Note
Go to the end to download the full example code.
Extracting parameters from multiple networks
Initializing
import matplotlib as mpl
import matplotlib.pyplot as plt
import seaborn as sns

# Load kb11_network and hastholmen_network
from example_data import HASTHOLMEN_NETWORK, KB11_NETWORK
from rich.console import Console

from fractopo import MultiNetwork, general

mpl.rcParams["figure.figsize"] = (5, 5)
mpl.rcParams["font.size"] = 8
Create MultiNetwork object
multi_network = MultiNetwork((KB11_NETWORK, HASTHOLMEN_NETWORK))
Extraction of parameters from multiple networks
# Choose columns, i.e. parameters, to extract
# Mostly scale-independent parameters are chosen here
# as the two networks represent two different scales of
# observation
columns = {
    general.NAME: (None, str),
    general.Param.AREA.value.name: (None, float),
    general.Param.CONNECTIONS_PER_TRACE.value.name: (None, float),
    general.Param.CONNECTIONS_PER_BRANCH.value.name: (None, float),
    general.Param.DIMENSIONLESS_INTENSITY_P22.value.name: (None, float),
    general.Param.DIMENSIONLESS_INTENSITY_B22.value.name: (
        None,
        float,
    ),
}

# Generate pandas DataFrame with wanted columns
# Each row represents one Network
extracted_multi_network_param_df = multi_network.basic_network_descriptions_df(
    columns=columns
)

# Print results
Console().print(extracted_multi_network_param_df)
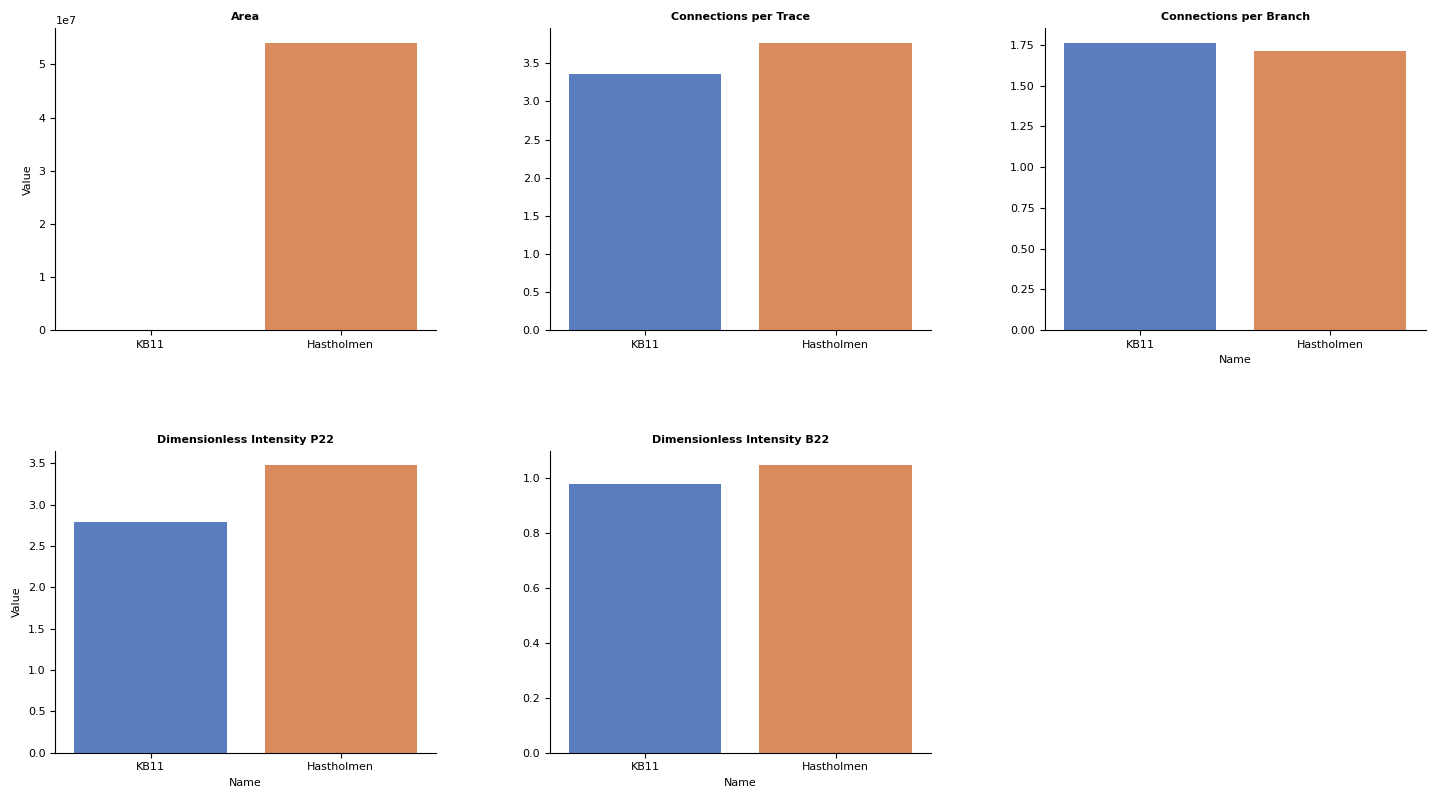
Name                                KB11    Hastholmen
Area                         1237.900366  5.408953e+07
Connections per Trace           3.360983  3.770563e+00
Connections per Branch          1.763537  1.711111e+00
Dimensionless Intensity P22     2.785521  3.474457e+00
Dimensionless Intensity B22     0.981090  1.048128e+00
Plot parameters for both networks
# Transpose and reset index so 'Name' is a column
df_t = extracted_multi_network_param_df.T.reset_index()
df_t.columns.name = None
df_t = df_t.rename(columns={"index": "Name"})

# Melt the data so each parameter is a row
df_melted = df_t.melt(id_vars="Name", var_name="Parameter", value_name="Value")

# Create the FacetGrid with col_wrap
# We use col_wrap=3 to force a 2-row layout for the chosen variables
g = sns.FacetGrid(
    df_melted,
    col="Parameter",
    col_wrap=3,
    sharey=False,
    sharex=False,
    height=4,
    aspect=1.2,
)

# Map the barplot
g.map_dataframe(sns.barplot, x="Name", y="Value", hue="Name", palette="muted")

# Refine formatting
g.set_titles("{col_name}", weight="bold")
g.add_legend()

# Tighten layout so titles don't overlap
plt.subplots_adjust(hspace=0.4, wspace=0.3)
Total running time of the script: (0 minutes 2.039 seconds)