Note
Go to the end to download the full example code.
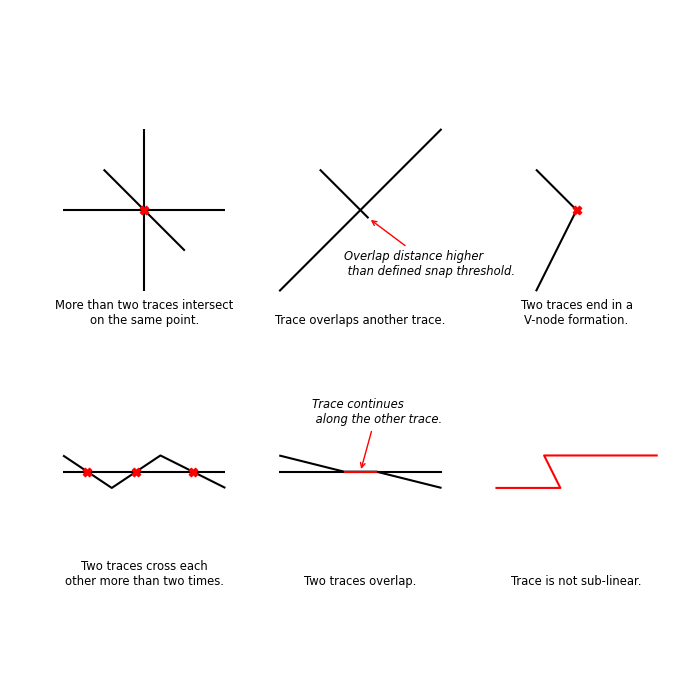
Visualize different types of validation errors
This example demonstrates using shapely and geopandas for visualization
purposes. The different types of trace validation error scenarios are created
declaratively in code with shapely geometries (LineStrings).
Just scroll down to the bottom if you are interested in the visualization
output.
Imports
import logging
from pathlib import Path
from typing import Sequence

import geopandas as gpd
import matplotlib.pyplot as plt
from matplotlib.axes._axes import Axes
from matplotlib.figure import Figure

# Import the geometries used to create traces and target areas.
from shapely.geometry import LineString, Point
Traces are explicitly defined in code and plotted
# Initialization
fig: Figure
fig, axes = plt.subplots(2, 3, figsize=(7, 7))
fig.tight_layout(h_pad=1.5)

axes_flat: Sequence[Axes] = axes.flatten()


for ax in axes_flat:
    ax.set_xlim(-6, 6)
    ax.set_ylim(-6, 6)
    ax.axis("off")
    # ax.text(x=-5, y=5, s=next(labeler), fontsize="x-large", fontweight="bold")

default_text_kwargs = dict(ha="center", fontdict=dict(size="small"))

# Axis 1: MULTI JUNCTION

axis_1 = axes_flat[0]

traces_1 = gpd.GeoDataFrame(
    geometry=[
        LineString([(-5, 0), (5, 0)]),
        LineString([(0, 5), (0, -5)]),
        LineString([(-2.5, 2.5), (2.5, -2.5)]),
    ]
)
errors_1 = gpd.GeoDataFrame(geometry=[Point(0, 0)])
traces_1.plot(ax=axis_1, color="black")
errors_1.plot(ax=axis_1, marker="X", color="red", zorder=10)
axis_1.text(
    x=0,
    y=-7,
    s="More than two traces intersect\non the same point.",
    **default_text_kwargs,
)

# Axis 2: MULTI JUNCTION

axis_2 = axes_flat[1]

traces_2 = gpd.GeoDataFrame(
    geometry=[
        LineString([(-2.5, 2.5), (0.5, -0.5)]),
        LineString([(-5, -5), (5, 5)]),
    ]
)
traces_2.plot(ax=axis_2, color="black")
axis_2.annotate(
    "Overlap distance higher\n than defined snap threshold.",
    xy=(0.5, -0.5),
    xytext=(-1.0, -4),
    arrowprops=dict(arrowstyle="->", color="red"),
    fontstyle="italic",
    fontsize="small",
)
# axis_2.set_title("Trace overlaps another trace.")
axis_2.text(x=0, y=-7, s="Trace overlaps another trace.", **default_text_kwargs)

# Axis 3: V NODE

axis_3 = axes_flat[2]

traces_3 = gpd.GeoDataFrame(
    geometry=[
        LineString([(-2.5, 2.5), (0, 0)]),
        LineString([(-2.5, -5), (0, 0)]),
    ]
)
errors_3 = gpd.GeoDataFrame(geometry=[Point(0, 0)])
traces_3.plot(ax=axis_3, color="black")
errors_3.plot(ax=axis_3, marker="X", color="red", zorder=10)
# axis_3.set_title("Two traces end in a\nV-node formation.")
axis_3.text(
    x=0,
    y=-7,
    s="Two traces end in a\nV-node formation.",
    **default_text_kwargs,
)

# Axis 4: MULTIPLE CROSSCUTS

axis_4 = axes_flat[3]

traces_4 = gpd.GeoDataFrame(
    geometry=[
        LineString([(-5, 0), (5, 0)]),
        LineString([(-5, 1), (-2, -1), (1, 1), (5, -1)]),
    ]
)
intersections = traces_4.geometry.values[0].intersection(traces_4.geometry.values[1])

errors_4 = gpd.GeoDataFrame(geometry=list(intersections.geoms))

traces_4.plot(ax=axis_4, color="black")
errors_4.plot(ax=axis_4, marker="X", color="red", zorder=10)
# axis_4.set_title("Two traces cross each\nother more than two times.")
axis_4.text(
    x=0,
    y=-7,
    s="Two traces cross each\nother more than two times.",
    **default_text_kwargs,
)

# Axis 5: OVERLAPPING

axis_5 = axes_flat[4]

traces_5 = gpd.GeoDataFrame(
    geometry=[
        LineString([(-5, 0), (5, 0)]),
        LineString([(-5, 1), (-1, 0), (1, 0), (5, -1)]),
    ]
)
intersections = traces_5.geometry.values[0].intersection(traces_5.geometry.values[1])
assert isinstance(intersections, LineString)

errors_5 = gpd.GeoDataFrame(geometry=[intersections])

traces_5.plot(ax=axis_5, color="black")
errors_5.plot(ax=axis_5, color="red", zorder=10)
# axis_5.set_title("Two traces cross each\nother more than two times.")
axis_5.text(
    x=0,
    y=-7,
    s="Two traces overlap.",
    **default_text_kwargs,
)
axis_5.annotate(
    "Trace continues\n along the other trace.",
    xy=(0.0, 0.0),
    xytext=(-3, 3),
    arrowprops=dict(arrowstyle="->", color="red"),
    fontstyle="italic",
    fontsize="small",
)

# Axis 6: OVERLAPPING

axis_6 = axes_flat[5]

traces_6 = gpd.GeoDataFrame(
    geometry=[
        LineString([(-5, -1), (-1, -1), (-2, 1), (5, 1)]),
    ]
)

traces_6.plot(ax=axis_6, color="red")
# axis_6.set_title("Two traces cross each\nother more than two times.")
axis_6.text(
    x=0,
    y=-7,
    s="Trace is not sub-linear.",
    **default_text_kwargs,
)
# axis_6.annotate(
#     "Trace continues\n along the other trace.",
#     xy=(0.0, 0.0),
#     xytext=(-3, 3),
#     arrowprops=dict(arrowstyle="->", color="red"),
#     fontstyle="italic",
#     fontsize="small",
# )

plt.subplots_adjust(wspace=0.11, hspace=-0.31)

if __name__ == "__main__":
    # Save plot for usage outside sphinx
    # This section can be ignored if looking at the documentation
    # online
    output_name = "validation_errors.png"
    try:
        output_path = Path(__file__).parent / output_name
        fig.savefig(output_path, bbox_inches="tight")
    except Exception:
        # Log error due to e.g. execution as jupyter notebook
        logging.info(f"Failed to save {output_name} plot.", exc_info=True)
Total running time of the script: (0 minutes 0.598 seconds)