Note
Go to the end to download the full example code.
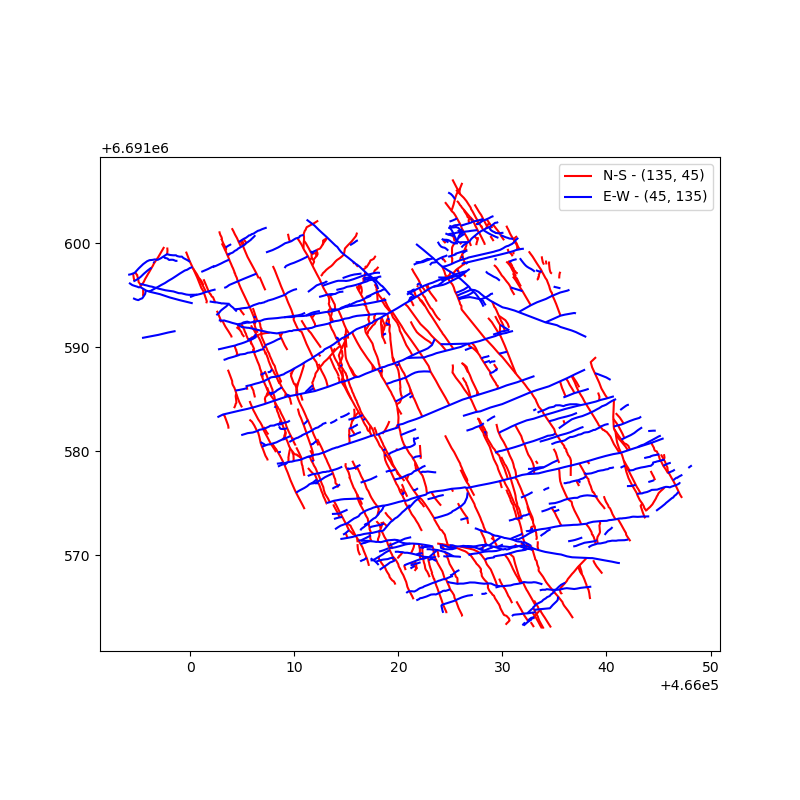
Visualizing azimuth sets
Initializing
from pprint import pprint

import matplotlib.pyplot as plt

# Load kb11_network network from examples/example_data.py
from example_data import KB11_NETWORK
pprint((KB11_NETWORK.azimuth_set_names, KB11_NETWORK.azimuth_set_ranges))
(('N-S', 'E-W'), ((135, 45), (45, 135)))
pprint(KB11_NETWORK.trace_azimuth_set_counts)
{'E-W': 315, 'N-S': 394}
fig, ax = plt.subplots(figsize=(8, 8))
colors = ("red", "blue")
assert len(colors) == len(KB11_NETWORK.azimuth_set_names)
for azimuth_set, set_range, color in zip(
    KB11_NETWORK.azimuth_set_names, KB11_NETWORK.azimuth_set_ranges, colors
):
    trace_gdf_set = KB11_NETWORK.trace_gdf.loc[
        KB11_NETWORK.trace_gdf["azimuth_set"] == azimuth_set
    ]

    trace_gdf_set.plot(color=color, label=f"{azimuth_set} - {set_range}", ax=ax)
plt.legend()
plt.show()
Total running time of the script: (0 minutes 0.336 seconds)