Note
Go to the end to download the full example code.
Plotting topological ternary plots with fractopo
Initializing
from pprint import pprint

# Load kb11_network network from examples/example_data.py
from example_data import KB11_NETWORK
Point already matches a coordinate point in trace.
point: POINT (466024.01981982775 6692098.386310579), trace: LINESTRING (466023.42354138196 6692098.175793974, 466023.56934693456 6692098.227270745, 466023.71742809657 6692098.279550923, 466024.01981982775 6692098.386310579, 466024.2524532033 6692098.468441982, 466024.55418436136 6692098.572371604, 466025.4048296623 6692098.865371656, 466025.64345226996 6692098.9475638885, 466025.68120606244 6692098.96056797, 466027.39570949227 6692099.43681892, 466028.1894610794 6692099.627319304)
Returning original trace without changes.
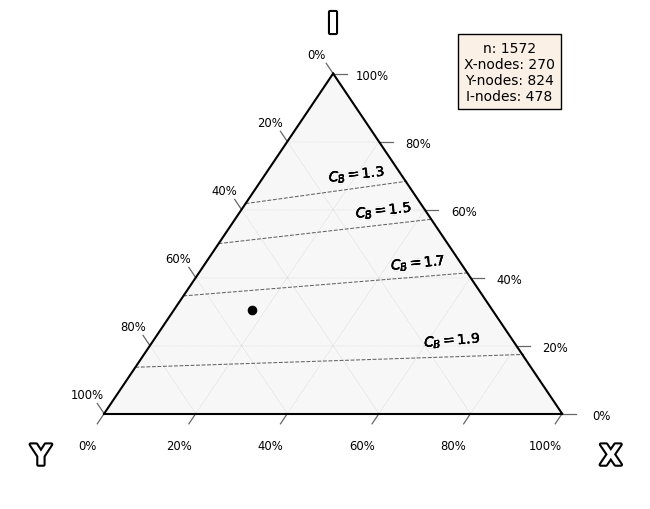
Plotting a ternary plot of fracture network node counts
xyi_fig, xyi_ax, xyi_tax = KB11_NETWORK.plot_xyi()
/nix/store/vkgh5vw7aniawrz4d17h6nz0isxxrprc-python3.13-python-ternary-1.0.8/lib/python3.13/site-packages/ternary/plotting.py:148: UserWarning: No data for colormapping provided via 'c'. Parameters 'vmin', 'vmax' will be ignored
  ax.scatter(xs, ys, vmin=vmin, vmax=vmax, cmap=colormap, **kwargs)
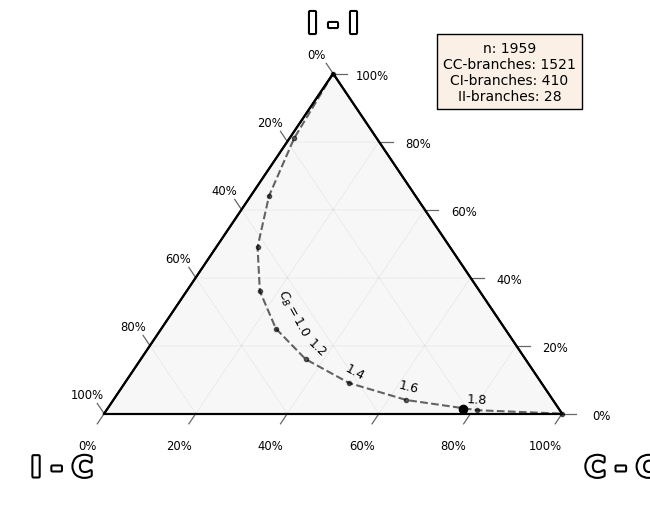
Plotting a ternary plot of fracture network branch counts
branch_fig, branch_ax, branch_tax = KB11_NETWORK.plot_branch()
Numerical data is accessible
pprint(dict(node_counts=KB11_NETWORK.node_counts))

pprint(dict(branch_counts=KB11_NETWORK.branch_counts))
{'node_counts': {'E': 114, 'I': 476, 'X': 268, 'Y': 826}}
{'branch_counts': {'C - C': 1521,
                   'C - E': 100,
                   'C - I': 408,
                   'E - E': 1,
                   'I - E': 12,
                   'I - I': 28}}
Total running time of the script: (0 minutes 30.868 seconds)