Gallery of fractopo example scripts and/or plots
All matplotlib plots can be saved with:
fig.savefig("savename.png", bbox_inches="tight")
# Or
plt.savefig("savename.png", bbox_inches="tight")
Where savename can be replaced with name/path of where you
want to save the figure. bbox_inches is given to make sure the whole
plot is saved even thought individual elements go outside the matplotlib
figure bounding box. png extension can be replaced with e.g. svg.
See https://matplotlib.org/ for more information about plotting.


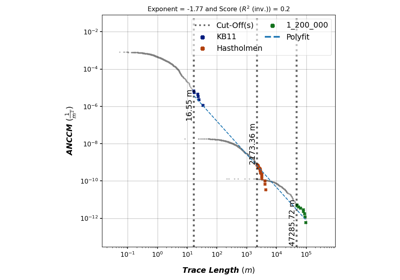
Plotting multi-scale fracture networks with fractopo
Plotting multi-scale fracture networks with fractopo


Module for creating fractopo.Network objects for examples
Module for creating fractopo.Network objects for examples

Exporting trace data with, e.g., length and azimuth attributes included
Exporting trace data with, e.g., length and azimuth attributes included
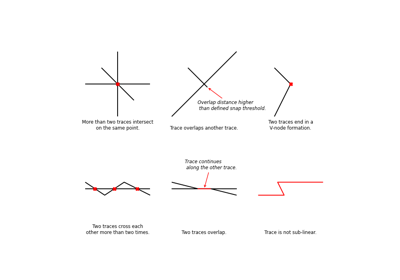

Script to create a workflow visualization of fractopo.
Script to create a workflow visualization of fractopo.