2. How to use fractopo web interfaces for validation and network analysis
A web interface for validation and network analysis of fractures and
lineaments are provided as part of fractopo. See fractopo for
info about getting it running. You might have it “privately” available
as part of a course or project. Please use the link(s) provided to you
to access the interface. Validation and network analysis are available
under different links.
The interfaces are meant to be as intuitive as possible. Input data
consists of a geospatial database file containing the fracture or
lineament trace data, e.g. a GeoPackage (.gpkg) file and another
database file with the target area. Use the two upload areas to upload
both the trace and area databases. You need to specify the layer name
for the right layer in the database if it does not match the filename
of the database. E.g. if your fracture traces are in traces.gpkg
with layer name traces, you do not need to specify the layer name.
Note
If you are uploading GeoPackages, make sure you do not have QGIS open
and the data of those GeoPackages loaded in Layers of QGIS. This
can cause the data you upload to contain an older copy of the actual
database contents. You can also notice this situation, if next to the
.gpkg, there exists files with same names but a suffix like
.gpkg-shm and .gpkg-wal. If these files exist, make sure you
close QGIS, or any other GIS software where you might have these
layers loaded before uploading.
After uploading these two data, you might need to change the settings of the process before running validation or analysis. See Validation and Network analysis subsections below.
2.1. Validation
The validation interface should look something like this:
Screenshot of validation web interface
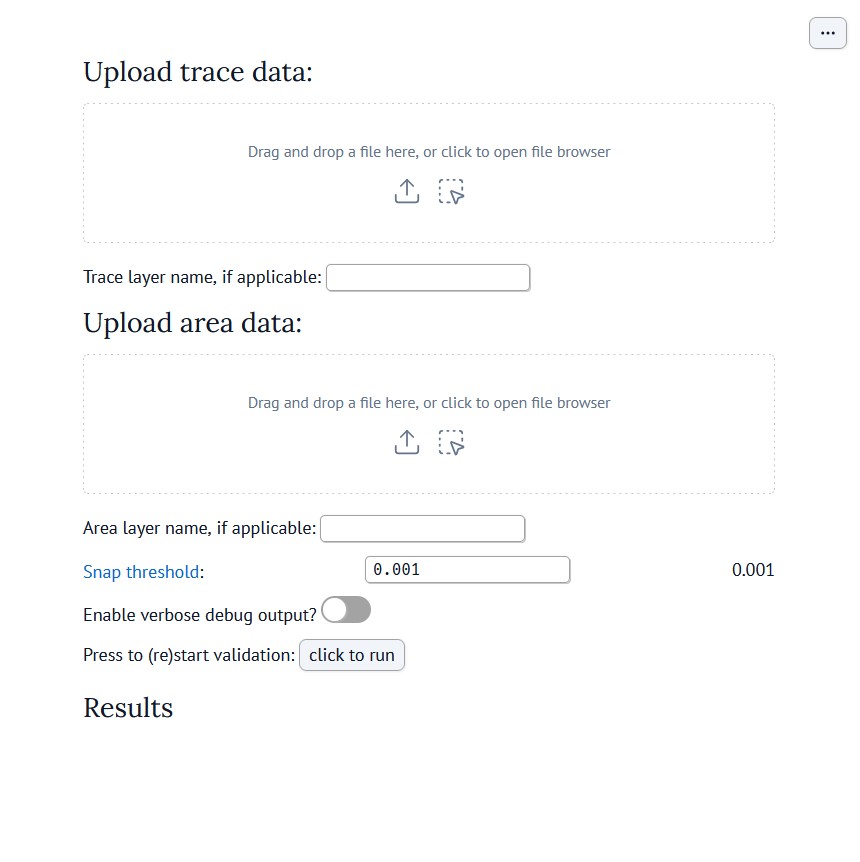
Validation web interface of fractopo.
You normally do not need to change any settings before running
validation. If you run into problems, you might want to enable verbose
output and report the problem as an Issue on GitHub:
https://github.com/nialov/fractopo/issues. Note that validation errors
(Validation errors) are something you need to fix in the trace
(or area) data, not a problem of the interface.
See Validation exports section below about what to do with the validated traces.
2.2. Network analysis
The network analysis interface should look something like this:
Screenshot of analysis web interface
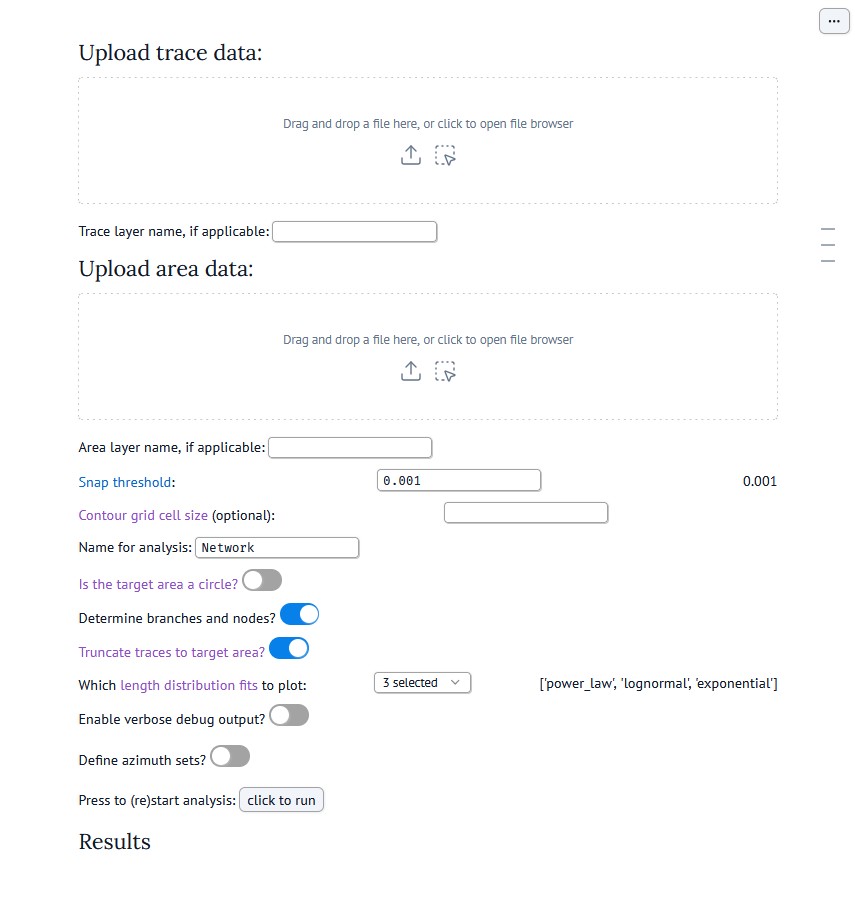
Network analysis web interface of fractopo.
You usually want to at least check the contour grid cell size,
Name for analysis and Is the target area a circle? settings.
Contour grid cell size determines the size of the rectangles used to
sample the whole target area for parameters, such as, fracture
intensity. Name for the analysis determines the name used in e.g. plot
titles that are outputted from the analysis. If the used target area is
shaped like a circle, this can be used to provide additional statistical
parameters and, e.g, handle partly unknown trace lengths better. To get
more info about some of the settings, click the link that is embedded in
the option title text.
If you want to set azimuth sets (often called fracture sets), click the
Define azimuth sets? toggle. Next, set the number of wanted sets.
Then, for each set, input the minimum and maximum value for the set.
Note that you can define a set that wraps around 0. E.g. a set,
labeled as N-S could be defined to start from 165 and end
at 15. See screenshots below.
Examples of defining azimuth sets
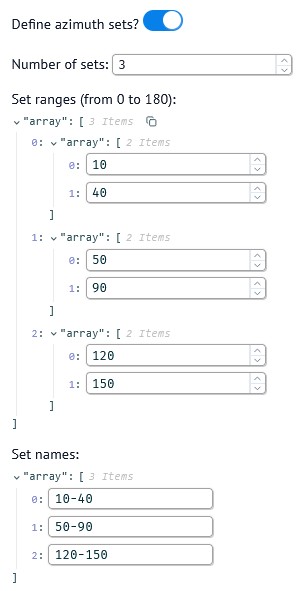
Example of definition of three azimuth sets with automatically defined labels.
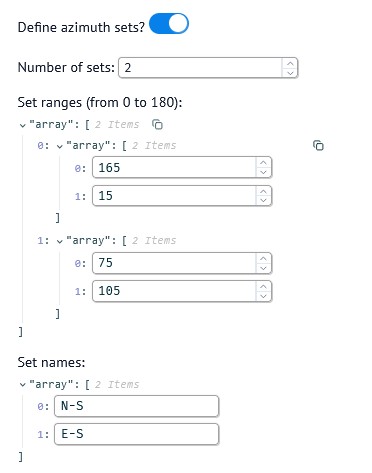
Example definition of two azimuth sets where the first (N-S)
wraps around 0 degrees and with user-defined labels.
2.3. Downloading and exploring output data
Note
Both validation and network analysis take some processing time before the results appear. Wait patiently for the results to show and scroll to the bottom to find the download link. For few hundreds of digitized traces, the computing time is usually in seconds or tens of seconds. However, if you define a contour grid cell size for network analysis, the processing time will be significantly increased, depending on the cell size, due to the computational intensity of contouring. Use a larger cell size to reduce computation time.
Both the validation and analysis interfaces output the results as a
downloadable .zip archive. Some textual results are also shown
during processing. Extract the results from the archive to explore them.
The results, including databases, plots and textual data, are provided
in multiple formats for maximum interoperability. The file name
identifies the contents. You can use the file type most suitable to you.
2.3.1. Validation exports
Validation results consists of just the traces in few different
geospatial file formats. If you open the downloaded traces, you will
notice the inclusion of a new column, VALIDATION_ERRORS, within the
attribute table of the data. Use the values there to identify errors in
the trace data and fix them accordingly (See Validation errors).
You can fix them in the original data you inputted or directly in the
output trace data. After fixing your trace data, run it again through
the interface. Make sure to use the file where you have done the
edits. If errors remain, fix them again and continue until no errors
remain.
As a general tip, make sure to clearly fix the errors pointed out by the validation to avoid having to do multiple rounds of validation. For example, if multiple traces intersect near each other, edit them to clearly avoid each other.
Note
If the trace data you inputted contained additional attribute data,
make sure to check that it is correct in the output data as well.
Data transformations during fractopo processing might cause
unexpected changes in attribute columns or values.
2.3.2. Network analysis exports
The network analysis exports include a selection of most basic analysis
that can be done on a fracture/lineament network. The exports also
include the defined branches and nodes which can be further explored or
analyzed outside fractopo. Use the file names to identify what the
files contain. Most often used plots results include orientation plots
(e.g. trace_length_weighted_rose_plot.png), contour plots (e.g.
P21_contour.png) and length distribution plots (e.g.
trace_length_distribution_fits.png).
Note
The exports only contain a selected set of analysis possible with
fractopo. Further analysis is possible by calling fractopo as
a Python library i.e. by coding (See
Notebook - Fractopo – KB11 Fracture Network Analysis and Gallery of fractopo example scripts and/or plots).